MCP Tool Metadata Collection & Display
We added automatic tool discovery and token usage tracking across your MCP installations. Now you can see exactly what tools are available in each MCP server and how much context window they consume.
What Changed
For Users
Before this update:
- You had no way to see what tools were available in your installed MCP servers. This made it hard to know what you could actually do with each installation.
- Token consumption was invisible - you couldn't tell how much context window each MCP server was eating up.
- Understanding the value of DeployStack's hierarchical router required taking our word for it.
After this update:
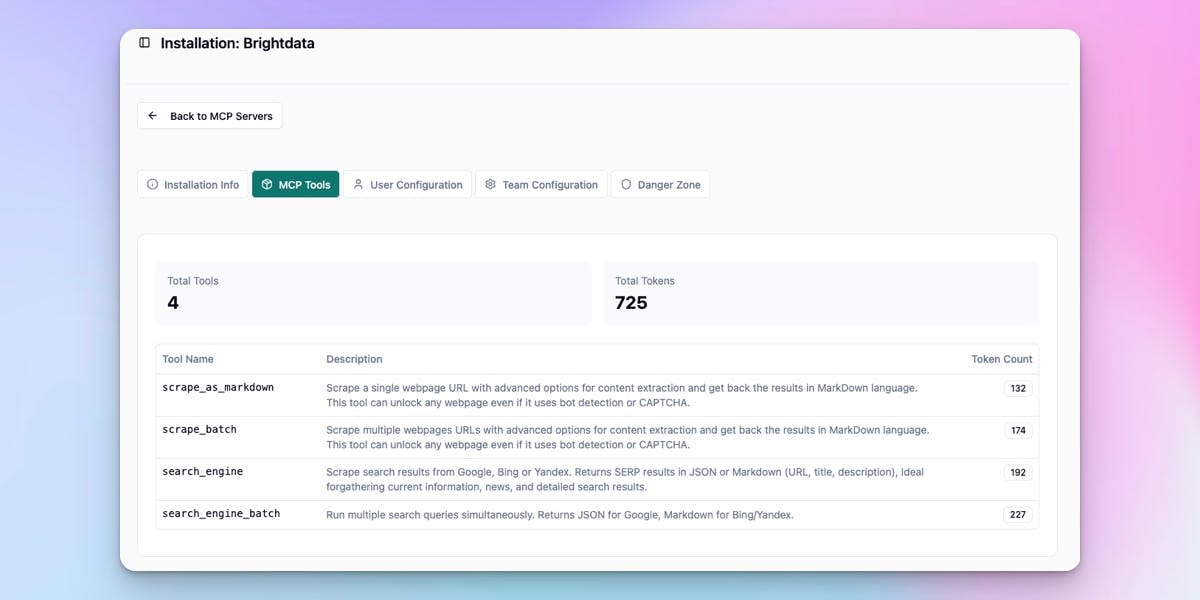
- Each MCP installation now shows a complete list of available tools with descriptions, so you know exactly what you're working with.
- Token consumption gets calculated and displayed for every tool.
- You can see the total token savings from using DeployStack's hierarchical router with real numbers.
- We show you a side-by-side comparison: traditional MCP vs DeployStack's method.
New Capabilities
1. Automatic Tool Discovery
- When you install an MCP server, DeployStack automatically discovers all available tools. Tool metadata like names, descriptions, and input schemas get collected and stored, while token consumption is calculated for each tool.
2. Tool Visibility
- Browse complete tool lists for each MCP installation, with detailed descriptions and input schemas so you understand what each tool does before using it.
3. Token Usage Analytics
- See total tokens consumed by all your MCP installations. Compare the old way (all tools loaded) vs DeployStack's hierarchical router (just 2 meta-tools), and visualize token savings percentage across your team.
4. Team-Wide Insights
- Get an aggregated view across all team installations showing total tool count and token savings from using DeployStack.
Technical Implementation
Backend Changes
- New Database Table: `mcpToolMetadata` stores tool information per installation
- New API Endpoints:
- `GET /api/teams/:teamId/mcp/installations/:installationId/tools` - fetch tools for a specific installation
- `GET /api/teams/:teamId/mcp-tools/summary` - get aggregated token savings summary
- New Event Handler: `mcp-tools-discovered-handler.ts` processes tool metadata from satellites
- New Permission: `mcp.tools.view` controls access to tool metadata
Satellite Changes
- Event Emission: Satellites now send `mcp.tools.discovered` events to backend after tool discovery
- Token Calculation: Uses existing `token-counter.ts` utility to calculate tokens per tool
- Automatic Sync: Tool metadata syncs automatically when MCP servers start
- Discovery Managers Updated: Both stdio and remote tool discovery managers emit events
Frontend Changes
- New Service: `mcpToolsService.ts` handles API calls for tool metadata
- New Store: `mcpToolsStore.ts` manages tool metadata state with Pinia
- API Integration: Ready for UI components to display tool lists and token savings
Data Flow
1. User installs MCP server via frontend
2. Backend sends command to satellite
3. Satellite spawns/connects to MCP server
4. Satellite discovers tools and calculates token counts
5. Satellite emits mcp.tools.discovered event to backend
6. Backend stores tool metadata in database
7. Frontend fetches tool data via API
8. Users see tool lists and token savings in dashboard
Benefits
For Solo Developers
You can now see exactly what tools you have access to and understand token consumption at a glance. This helps you make informed decisions about which MCP servers to turn on.
For Teams
Get shared visibility into available tools and track token usage across all team installations. You can demonstrate ROI from using DeployStack's hierarchical router with real numbers.
For Enterprise
Audit what tools are available to users, monitor context window consumption, and improve MCP server selection based on actual usage data.
Example Use Case
Before:
A team has 5 MCP servers installed, but they have no idea how many tools are available or what token consumption looks like. It's hard to explain why DeployStack is better than traditional MCP without concrete numbers.
After:
The team sees: 5 installations, 87 total tools. The old way would consume 12,450 tokens. DeployStack's hierarchical router uses just 950 tokens. That's 96.19% savings - clear proof that DeployStack prevents context window bloat.
What's Next
This system sets us up for:
- Token Analytics Dashboard (coming soon) - visual charts showing context window usage
- Smart Recommendations (planned) - suggest which servers to disable based on usage
- Usage Reports (planned) - track which tools your team uses most
Breaking Changes
None. This is a purely additive feature.
Migration Required
None. Tool discovery happens automatically for all existing and new installations.
Security Considerations
- Tool metadata requires `mcp.tools.view` permission
- Team isolation enforced at API level
- No sensitive data exposed (only tool schemas and descriptions)
Known Limitations
- Historical data not available for installations created before this update (will populate on next server restart)
- Token calculations use gpt-tokenizer (provider-agnostic approximation)